React Developer Tools enables you to inspect and edit React component state and props at runtime. You can edit and update the component state on the browser and see the effect without any re-load. Let us learn about installation, usage, and more about React Developer Tools by answering four important questions about react developer tools.

Inside this article:
- What are the React Developer Tools?
- How do I install it?
- How do I enable React Developer Tools?
- What do the React Developer Tools show us?
- Conclusion
What are the React Developer Tools?
React Developer Tools is a specific tool build to debug and understand react-specific projects. It also helps us to identify react application component tree. It enables us to update the state and props values and see what is happening at runtime. This specific tool is available for browsers as an extension.
How do I install React Developer Tools?
This tool is available as an extension for all major browsers. Let us look into how to install it for your browser.
Install React Developer Tools for Chrome
To install React developer tools for chrome you need to add to chrome by going to the Chrome web store and clicking on the “add to Chrome” button using the below link.
Once you visit the above URL you should similar screen as below.
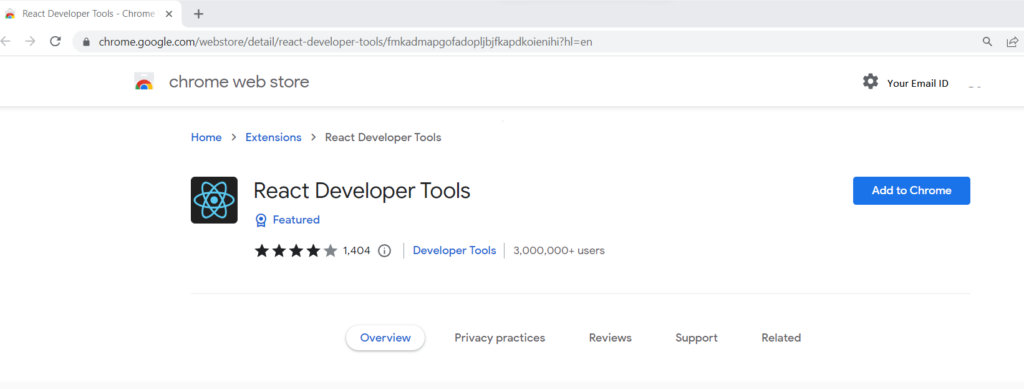
Once you click on “Add to Chrome” you should get the below popup to confirm the permissions.

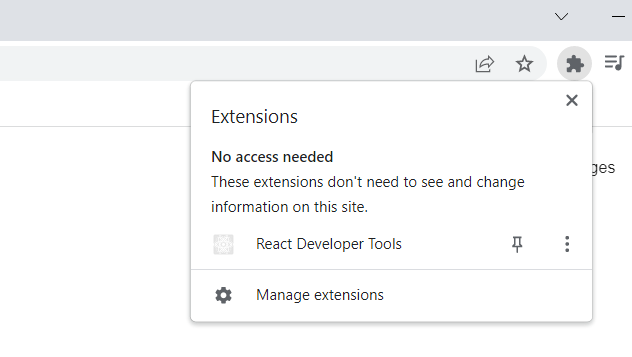
Next click on “Add extension”. Once installation is successful you should able to find it under Extensions as below.
Install React Developer Tools for Firefox
To install react developer tools for firefox you need to add to firefox by going to the Firefox browser ADD-ONS and clicking on the “Add to Firefox” button using the below link.
https://addons.mozilla.org/en-US/firefox/addon/react-devtools/
Once you visit the above URL you should see a similar window as below.
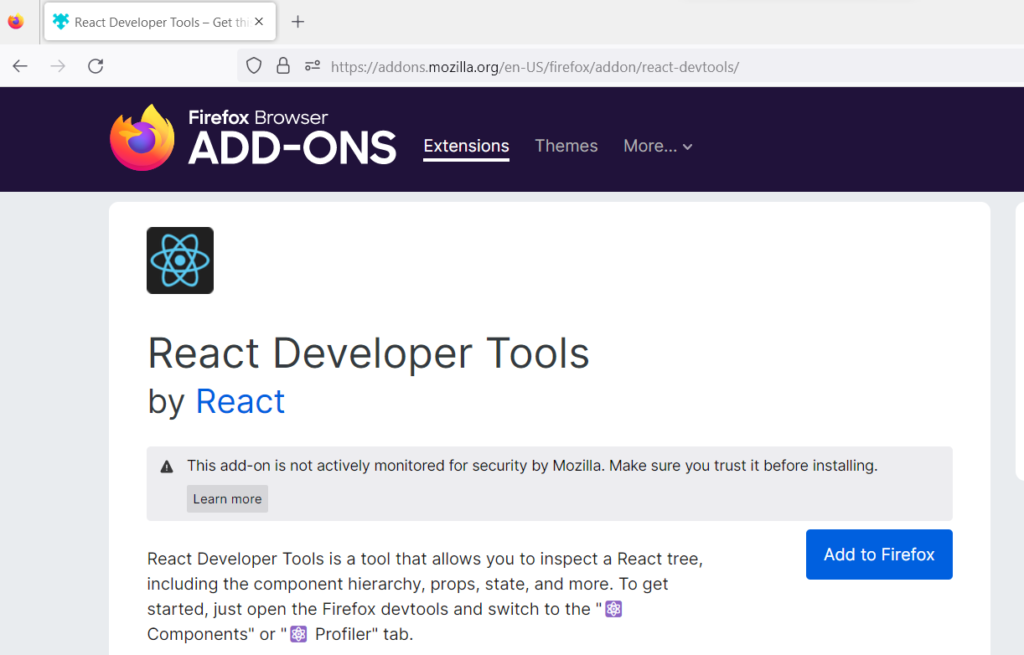
Click on “Add to Firefox”, you should get the below screen to confirm the permission to read data.
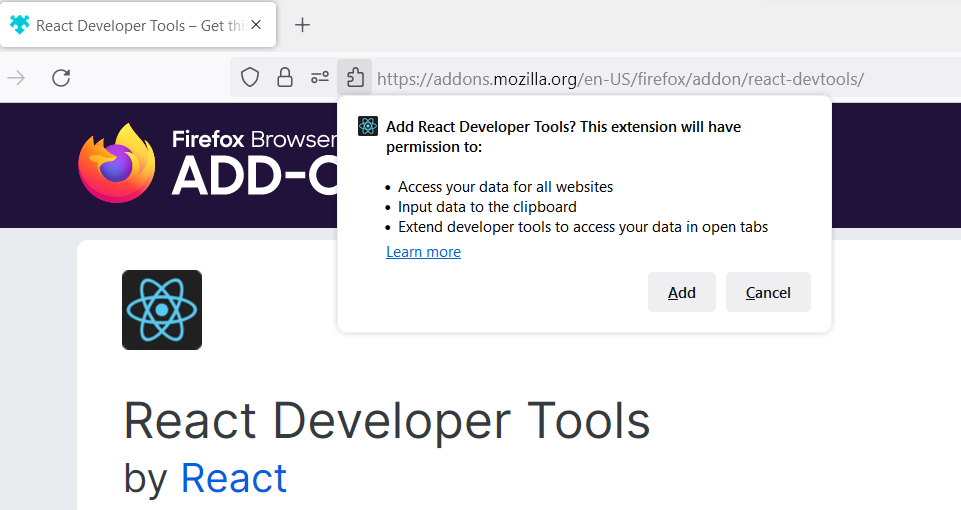
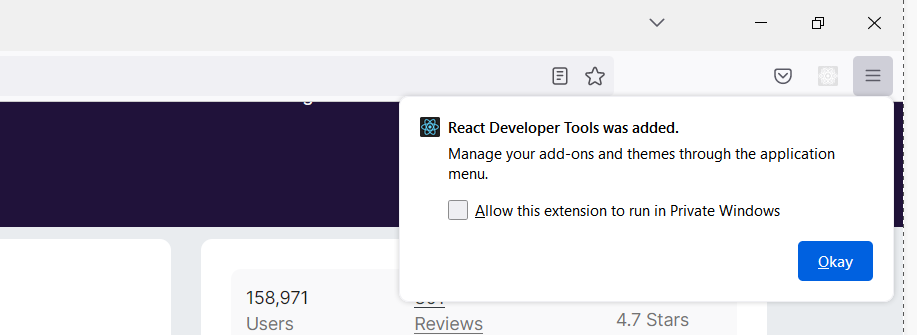
Click on the “Add” button. you should get the installation successful popup for firefox after completion as below.
Install React Developer Tools for Microsoft Edge
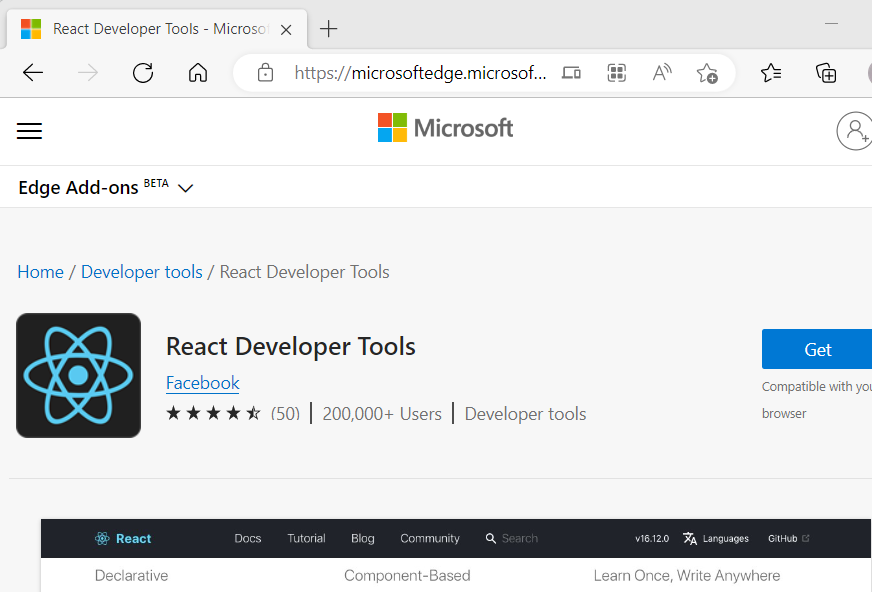
To install react developer tools for Microsoft Edge you need to get it by going to the Edge Add-ons and clicking on the “Get” button using the below link
React Developer Tools – Microsoft Edge Addons
Once you visit the above URL you should see a similar window as below.
Click on “Get” button and it should ask for permissions using popup as below.

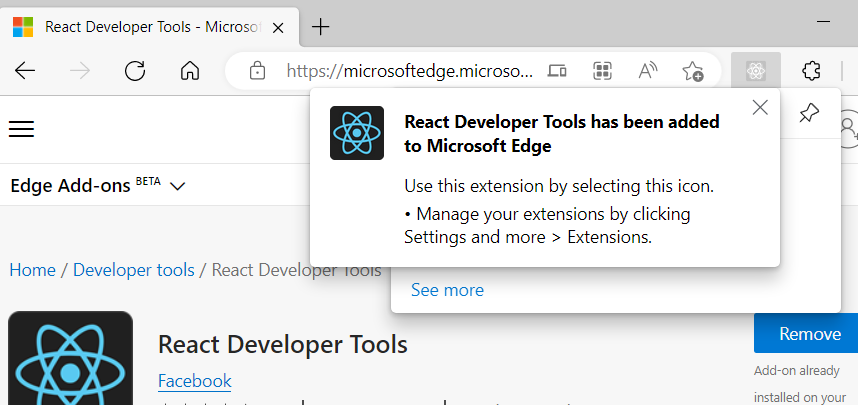
Click on “Add extension” and it should show the installation successful popup as below once completed.
How do I enable React Developer Tools?
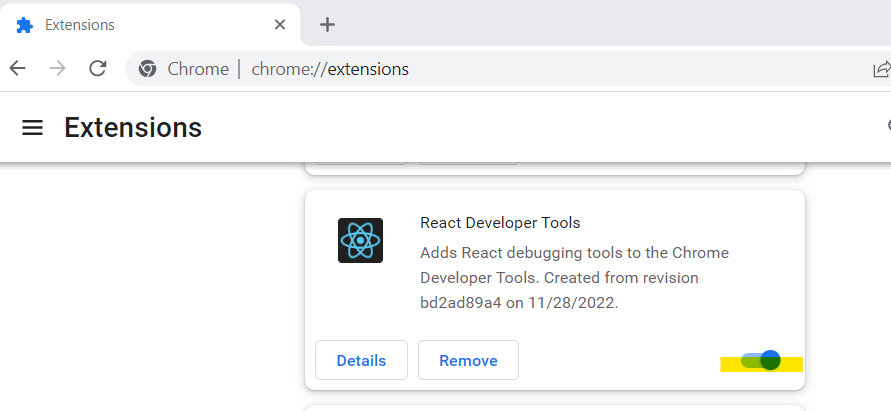
To enable/disable extension for Chrome go to “chrome://extensions/” in chrome. you should see the react developer tools extension and then click on enable/disable button as highlighted below.
To enable/disable extension for Firefox go to “about: addons” in firefox and find the react developer tools in the extensions sections. then, click on the highlighted button to enable/disable the extension.

To enable/disable extension for the Microsoft Edge, go to “edge://extensions/” in edge browser and then find it. after that, click on highlighted button for enable/disable the extension.

What do the React Developer Tools show us?
To demo the usage of the tools, I am using the react project from a previous blog post which you can read here. Once your app running using “npm start” click on “extensions” and select the tool below.

Once you click on the tool, the first thing it will show you is about what build your react application is using as below.
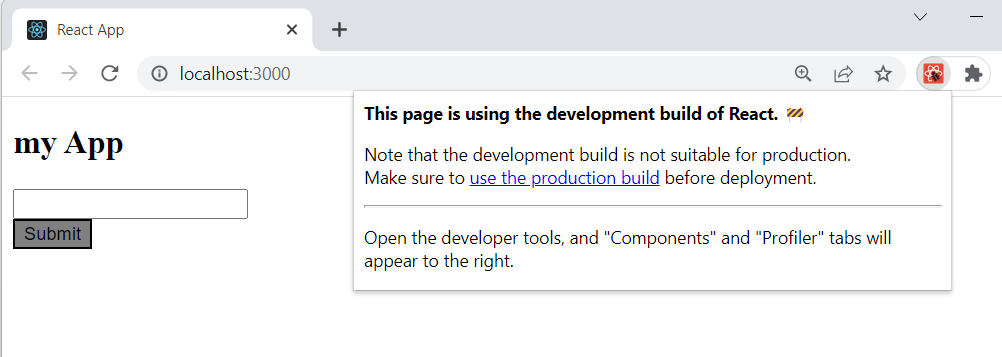
As tool is suggesting where to go, Open the developer tools first by pressing F12 from keyboard and you should see the “Components” and “Profiler” tabs as below.
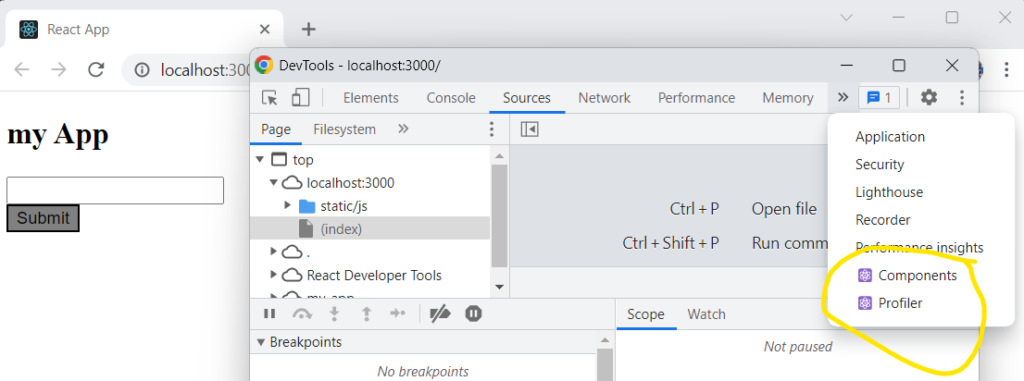
Components Tab
Let us click on “Components” first. Once you open the “Components” tab it will show you the loaded application components tree with props and state . You can also mouseover the tree nodes and identify the exact UI which is being rendered by the component as it highlighted the target component UI.
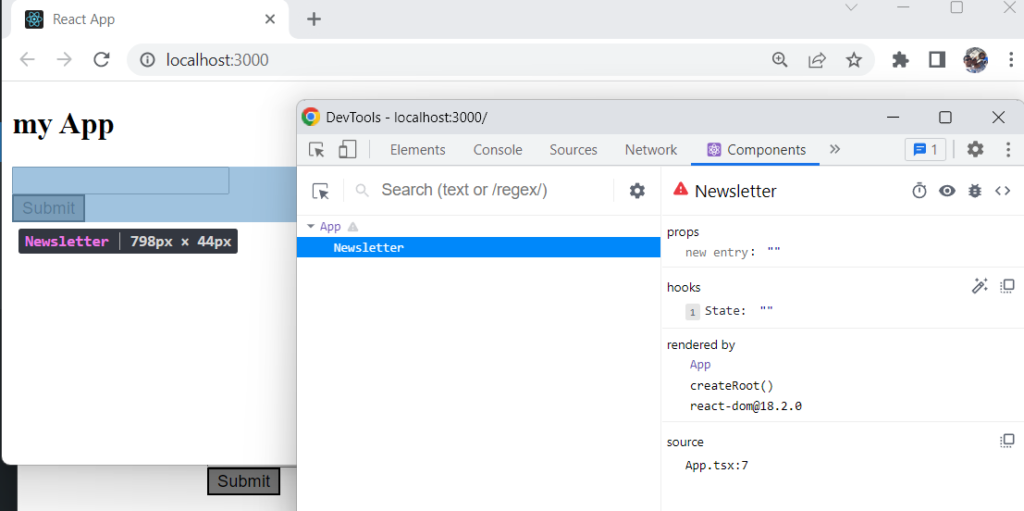
You can also update the props or hooks values directly in “Components” tab and same will be updated for react app and reflected on UI if that value is bound with any UI element. In below I am updating the “State” in Components section and you can see same is reflected on input box too.

Profiler Tab
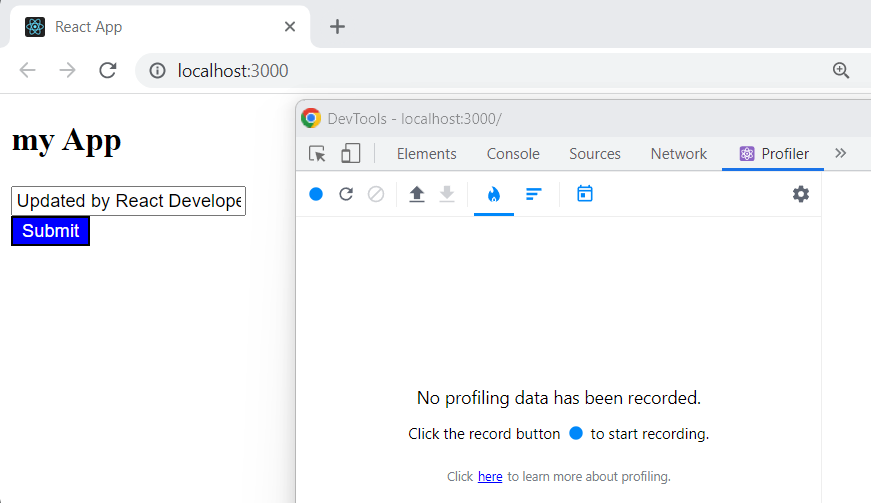
Now Click on “Profiler” Tab , it will say “No profiling data has been recorded” and suggest you to click on record button to start recording. Let us click on record button as suggested.
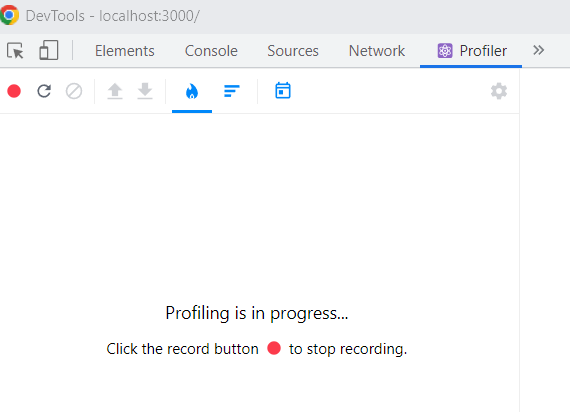
Once you click on start it will show below window as “Profiling is in progress” and tell you to click on stop button to stop recording.
Let us do some activities on UI, like change the input box text, click on Submit button and then click on “Stop recording” button to stop the profiling . Once you click on “Stop” button, you should see similar window as below.
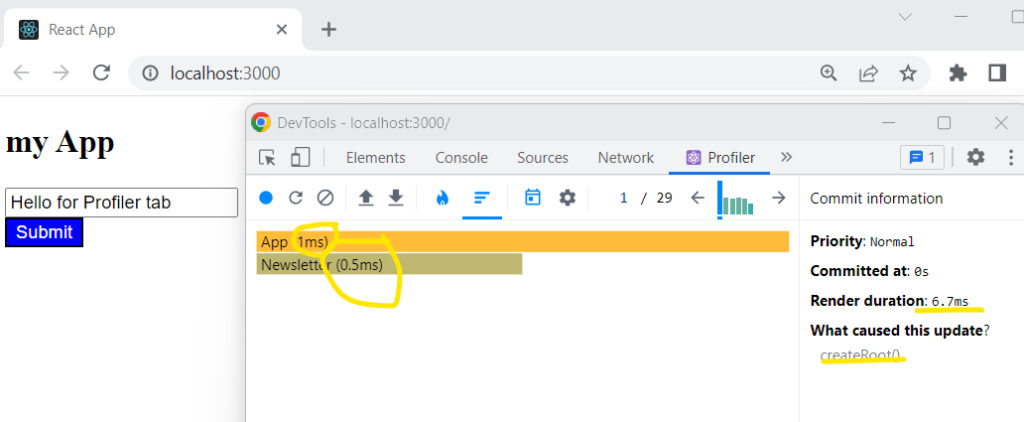
The React Developer Tools Profiler gives us various important information about Application Performance like how long the component took to render, how it is updated, and many other details. You can use all this information to analyze your application performance and identify any performance issues in react application.
Conclusion
The React Developer Tools is a great addition to your toolbox if you are a react developer. It shows you all important information about your application which you may need as a developer also gives you the ability to play with properties/hooks and analyze how your react application is responding.
you can learn more about react developer tools by going to react official website.
Thanks and Happy Learning :). Please give your valuable feedback and share this post if you liked and learned something from this post.
